Introduce regressions at the content layer
The trade-off. The scenario is closer to the intended failure mechanism, while still limited by synthetic traffic and a non-semantic transform.
Independent case study / Silent-Failure Observability
A simulation-based evaluation of answer-quality detectors for regressions that transport metrics do not capture. The comparison considers detection coverage, false positives, delay and modeled operating cost.
Scope. There is no live model provider, semantic embedding service, OpenTelemetry integration or customer traffic in this study. It does not establish production alert accuracy, real hallucination detection or customer incident outcomes.
01 / Problem & constraints
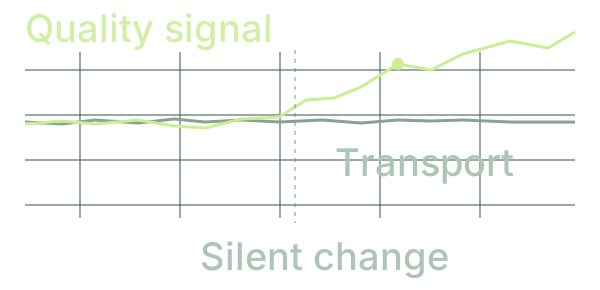
Request success and normal latency do not establish answer quality. Content can degrade without producing a transport error or a corresponding change in operational latency.
The experiment introduces text-level regressions into simulated traffic and compares detector behavior against non-regression controls. The evaluation examines whether detector combinations cover the intended failures without reacting to ordinary population changes.
Establish a consistent basis for detector selection across failure coverage, false positives, detection delay and modeled cost.
02 / Architecture
Inject degradation into text rather than directly perturbing feature vectors.
Use deterministic character 4-gram hashing into 256 dimensions; no external embedding service.
Use each detector's 30-day reference window and a three-consecutive-day alert rule.
Evaluate detection, control behavior, delay and coverage cost; publish reports and a static dashboard.
The deterministic text transform makes the experiment repeatable, but has no semantic understanding. The dashboard is generated output, not an operational service.
03 / Design decisions
The trade-off. The scenario is closer to the intended failure mechanism, while still limited by synthetic traffic and a non-semantic transform.
The trade-off. A comparable policy exposes sensitivity and delay trade-offs; it does not eliminate the need to recalibrate for real traffic.
The trade-off. The cheapest covering set depends on the observed scenarios; its apparent advantage cannot be assumed on a new workload.
04 / Technical ownership
Independent project ownership: design, implementation and evaluation. My professional cross-team responsibilities are described separately in Technical leadership.
Make both regressions and non-regressions part of the experiment so detection success cannot hide false alarms.
Inspect the traffic scenariosKeep the detection and evaluation assumptions explicit enough to challenge false-positive and delay behavior.
Inspect the evaluation logicUse mutation testing to identify tests that do not detect altered behavior, then document and correct the inadequate assertions.
Inspect the mutation harness05 / Results & interpretation
Topic-sliced PSI detected the localized regression while staying quiet on the population-shift control.
Slicing detected a diffuse regression later than aggregate detection in the documented simulation.
The modeled 24-call/day quality canary was not in the cheapest covering set: two free detectors covered everything it covered and more. Those are simulated budget assumptions, not a claim of production savings or real model calls.
06 / Implementation & documentation
Committed detector comparisons and findings from the simulated scenarios.
docs/results-stable.mdThe logic behind the alerts, not just a chart of the outcomes.
src/detectors.pyTypeScript generation of the static report dashboard.
dashboard/build.tsWhy hashed features and simulated traffic are not production observability evidence.
docs/known-limitations.mdPython · TypeScript · numpy · zero other dependencies
An AI feature degrades on a Tuesday. By Friday it is answering a fifth of questions with
polite, fluent, confident nonsense. Every request returns 200 OK in 400 milliseconds.
Error rate: zero. p95 latency: flat. Every dashboard is green, every SLO is met, and the
first anyone hears about it is a support ticket eleven days later.
That is the failure mode this project is about, and the reason APM cannot help is not that it is badly configured. It is that APM instruments the transport — status codes, latency, throughput — and this failure happens entirely inside the payload. There is nothing wrong with the response except what it says.
So: ninety days of simulated support-assistant traffic, five ways it silently degrades plus two controls, eight detectors, and one question — which detectors actually work, how many days late are they, and what does the cheapest adequate set cost?
pwsh ./build.ps1     # run the panel, generate the reports and the dashboard
pwsh ./test.ps1      # 151 tests, 12/12 mutants killed, 7 stages
pwsh ./demo.ps1      # the two-minute version
Read docs/results.md for the numbers and open
docs/dashboard.html for the picture.
120 requests a day for 90 days. Six streams, each with a different thing wrong with it — or, in two cases, nothing.
| stream | what happens | is it a regression? |
|---|---|---|
model-swap |
The provider routes traffic to a cheaper variant. Answers stay grammatical and stop containing the order number, the amount or the action taken. | yes |
retrieval-decay |
The index stops being rebuilt. Retrieval returns k documents with plausible scores; they are the wrong documents. The model writes an excellent answer to a question nobody asked. | yes |
refusal-creep |
A safety filter is tuned upstream. Refusals climb from 2% to 18%. Every refusal is a 200 with a polite body and an unhelped user. | yes |
template-regression |
A deploy drops a field from the prompt template for one topic. 8% of traffic gets a truncated answer; 92% is untouched. | yes |
input-shift |
A marketing push changes the topic mix. The model is performing exactly as well as before. | no — alerting here is a false positive |
healthy |
Nothing happens for ninety days. | no — alerting here is a false alarm |
Two design decisions do most of the work here.
Degradations are injected into the text, never into the vectors. A simulator that perturbed embeddings directly would be measuring its own arithmetic. Everything a detector sees, it sees because the words changed — the same reason it would with a real encoder.
input-shift and healthy are not decoration. Nearly every published comparison of
drift detectors reports true positives. The interesting question is what a detector does
when the population moves and the quality does not, because in production that happens
far more often than a regression does, and a detector that cannot tell the two apart is a
pager that teaches its owner to ignore it. Three of the eight detectors here fail that
test.
All eight are calibrated identically: the threshold is the 99th percentile of that detector's own scores over the 30-day reference window, and an alert requires three consecutive days over it. This matters more than it sounds. A comparison in which each detector gets a hand-picked constant is a comparison of the constants, and it is how monitoring bake-offs are rigged without anyone intending to.
| detector | what it looks at | cost |
|---|---|---|
| APM baseline | error rate, p95 latency | free — the control |
| PSI on output embeddings | per-dimension marginal drift in answers | free |
| PSI on input embeddings | the same, on questions | free |
| MMD on output embeddings | kernel two-sample test on the joint distribution | free |
| Refusal-rate CUSUM | share of answers that are polite declines | free |
| Answer self-similarity | mean pairwise similarity within a day's answers | free |
| Sliced PSI | output PSI computed within each topic, worst topic wins | free |
| Quality canary | 24 golden questions replayed daily against a reference centroid | 24 model calls/day |
Embeddings are character 4-gram feature hashing into R^256 — the hashing trick, a real
pre-transformer algorithm, chosen because it is deterministic, dependency-free, and a pure
function of the text. It has no semantics whatsoever, and
docs/known-limitations.md is explicit about which
conclusions that does and does not affect.
Full matrix in docs/results.md. The five findings:
1. Conditioning on the cohort buys sensitivity and specificity at the same time.
Sliced PSI was the only detector to catch the regression confined to 8% of traffic — every
aggregate detector dilutes it by a factor of twelve and misses it entirely — and it was
the only embedding detector that stayed silent on the population shift. Slicing by topic
removes exactly the variable input-shift moves. The usual sensitivity/specificity
trade-off is a consequence of asking a badly posed question, not a law of nature.
2. And it is not free. On the diffuse regression, sliced PSI alerted 12 days later than the aggregate, because each slice is a twelfth of the sample. This is why the covering set has two members and not one.
3. The expensive detector did not make the cut. The golden-set canary costs 24 model calls a day, was among the fastest on three regressions, and is absent from the cheapest covering set — two free detectors between them cover everything it covers and one thing it does not. Its blind spot is not statistical, it is a decision: the golden set was written at launch and covers four of six topics, and the regression it misses lives in one of the other two. Golden sets rot in exactly the direction of the traffic that grew after you wrote them.
4. A CUSUM calibrated on its own reference window is guaranteed to false-alarm, and fixing it took two goes. It is a reflected random walk, so it crosses any fixed threshold eventually — the first version alerted on all six scenarios, including the healthy control. Simulating the monitoring horizon fixed most of it. What remained was subtler: the detector estimates its target from 30 days and applies it to 60 fresh ones, and the error in that estimate is itself a drift that a one-sided CUSUM integrates into a linear ramp. Resampling the reference window and the horizon separately took the panel to zero false alarms across all eight detectors on ninety healthy days.
5. The detector I nearly deleted is in the covering set. Answer self-similarity was built on the theory that boilerplate answers resemble each other. Measured, the statistic moved the other way: a day containing two tight clusters is less self-similar than a day containing one, so partial contamination lowers it. As a one-sided detector it found nothing, anywhere. Scored two-sided — which is all the reference window ever licensed — it catches three of four regressions for zero model calls.
Sixteen predictions were recorded before the panel was run. Nine were contradicted.
The scoreboard is in docs/results.md, and the count in its heading is computed from the
table beneath it rather than typed, so the two cannot drift apart.
test.ps1 runs seven stages and the project's claims are only worth reading if all seven pass.
results-stable.md and dashboard-data.json hashed across two
runs. Wall-clock timing is confined to results.md so that the hashed file stays hashable.<script> tag and no URL. It is an artefact, not an app.numpy and
pytest and the TypeScript half imports nothing but node: builtins. Imports are
extracted by parsing (tools/imports.py), not by matching text: the regex version of
this check reported that the project depends on a module named the, having found
"from the healthy baseline in either direction" in a docstring.src/.Two of those mutants survived the first run, and both were right to. One test asserted a
tautology; another compared the optimised PSI against population_stability_index, which —
since the optimisation — is the optimised PSI. It was comparing the code to itself. The
fix was an independent reference implementation written in the test file. That is the whole
argument for mutation testing in one example: a green suite tells you the tests pass, not
that they would fail.
The first working version took 319 seconds. Two changes took it to 32:
Both were verified by the report coming out byte-identical, which is a much stronger statement than "the tests still pass" and is the reason the determinism stage exists.
src/embedding.py     hashing-trick embeddings, memoised
src/corpus.py        templates for questions, answers, refusals, stale and truncated answers
src/stream.py        the six scenarios and the ground truth
src/detectors.py     the statistics, the calibration, and the eight detectors
src/evaluate.py      scoring, set cover (greedy + exact), operating cost
src/predictions.py   16 design-time predictions, scored from the panel
src/report.py        markdown rendering
src/main.py          entry point
dashboard/build.ts   zero-dependency SVG dashboard generator
tools/mutate.py      mutation harness
tools/imports.py     AST-based dependency scanner used by test.ps1
docs/adr/            six decision records
docs/portfolio/      four essays
docs/results.md — the full matrix, cost table, covering set and prediction scoreboarddocs/dashboard.html — 54 sparklines, one per detector per scenariodocs/known-limitations.md — what a simulated corpus and a semantics-free embedding do and do not licensedocs/security-review.md — the privacy problem with shipping answer text to a monitoring systemdocs/adr/ — why the thresholds are calibrated rather than chosen, why delay is measured from materiality, and four moreThe essays are the parts I would want read first:
01 — The detector I nearly deleted — self-similarity detected nothing because my hypothesis had the sign backwards; two-sided, it is in the minimum covering set02 — Slicing bought sensitivity and specificity at the same time — the aggregate was measuring a mixture, and dilution and false positives were the same defect from two sides03 — Three attempts to calibrate one CUSUM — a calibration has to simulate the detector's ignorance, not just its arithmetic04 — Two mutants survived, and both tests were comparing the code to itself — a tautology and an oracle that had been refactored into the implementation07 / Limits & production considerations
There is no live model provider, semantic embedding service, OpenTelemetry integration or customer traffic in this study. It does not establish production alert accuracy, real hallucination detection or customer incident outcomes.
Before production I would need privacy-preserving telemetry, real quality labels, provider/version correlation, alert routing and on-call runbooks. These are proposed integration requirements, not features delivered by this simulation.